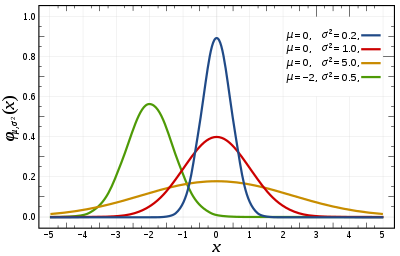
python-scipyHow do I use Python and SciPy to generate a Gaussian distribution?
The SciPy library provides a number of functions for generating a Gaussian distribution. To use Python and SciPy to generate a Gaussian distribution, the following steps need to be taken:
- Import the SciPy library:
import scipy.stats as stats- Generate the Gaussian distribution using the
stats.norm()function. The function takes three parameters: mean, standard deviation and size. For example, to generate a Gaussian distribution with mean 0 and standard deviation 1, use:
x = stats.norm(0, 1).rvs(1000)- Plot the Gaussian distribution using the
matplotliblibrary.import matplotlib.pyplot as plt
plt.hist(x, bins=30, density=True) plt.show()
The output will be a histogram of the generated Gaussian distribution:

## Helpful links
- [SciPy Documentation](https://docs.scipy.org/doc/scipy/reference/index.html)
- [Matplotlib Documentation](https://matplotlib.org/3.2.1/contents.html)More of Python Scipy
- How do I create a 2D array of zeros using Python and NumPy?
- How can I use Python Scipy to zoom in on an image?
- How do I use the trapz function in Python SciPy?
- How can I use Python and SciPy to read and write WAV files?
- How can I use Python and Numpy to zip files?
- How can I use Python and SciPy to find the zeros of a function?
- How can I use Python and Numpy to parse XML data?
- How do I upgrade my Python Scipy package?
- How do I create an array of zeros with the same shape as an existing array using Python and NumPy?
- How can I use the x.shape function in Python Numpy?
See more codes...